
Infogram vs Piktochart AI: Which AI Tool Wins?
Overview
Infogram and Piktochart AI are both popular tools for creating visual content, but they cater to slightly different needs. Infogram focuses on data visualization and interactive charts, while Piktochart AI leverages artificial intelligence to simplify design for infographics, reports, and presentations. This comparison will help you decide which tool aligns best with your workflow.
Key Features Comparison
- Data Visualization: Infogram excels with over 35 chart types, live data integration, and interactive elements. Piktochart AI offers basic charts but focuses more on infographic templates.
- AI Assistance: Piktochart AI includes AI-powered design suggestions and content generation, while Infogram has limited AI features.
- Templates: Piktochart AI provides a vast library of templates for various use cases, whereas Infogram offers fewer but more data-centric templates.
- Collaboration: Both support real-time collaboration, but Infogram offers more granular permissions.
- Export Options: Infogram supports high-resolution exports and embedding, while Piktochart AI offers PNG, PDF, and PowerPoint exports.
Pros & Cons
Infogram
- Pros:
- Excellent interactive charts and maps with real-time data integration.
- User-friendly drag-and-drop editor with a wide range of templates.
- Strong collaboration features for team projects.
- Good export options including PNG, PDF, and GIF.
- Cons:
- Limited free plan with watermark and restricted features.
- Steeper learning curve for advanced data visualization.
- Some users report occasional performance lags with large datasets.
Piktochart AI
- Pros:
- AI-powered design suggestions and automatic layout adjustments.
- Intuitive interface ideal for beginners and non-designers.
- Extensive library of templates and graphics.
- Affordable pricing plans with a generous free tier.
- Cons:
- Less robust for complex data visualization compared to Infogram.
- Limited interactivity in exported charts.
- Some advanced features require higher-tier plans.
Infogram
- Pros: Excellent for data visualization with a wide range of chart types and interactive features.
- Pros: Real-time collaboration and easy embedding for teams.
- Pros: Clean, professional templates suitable for business reports.
- Cons: Free plan has limited features and watermarks.
- Cons: Learning curve for advanced customization.
Piktochart AI
- Pros: AI-powered design suggestions speed up creation.
- Pros: User-friendly interface ideal for beginners.
- Pros: Good selection of templates for infographics and presentations.
- Cons: Limited data visualization options compared to Infogram.
- Cons: Some advanced features require higher-tier plans.
Infogram
- Pros: Excellent interactive charts and maps; real-time collaboration; wide range of templates.
- Cons: Steep learning curve for advanced features; limited free plan; export options restricted on lower tiers.
Piktochart AI
- Pros: AI-powered design suggestions; user-friendly interface; quick creation of infographics and reports.
- Cons: Less customizable than Infogram; limited data visualization options; AI features require subscription.
Infogram
- Pros: Superior data handling, interactive charts, real-time data integration, robust API.
- Cons: Steeper learning curve, less intuitive for beginners, higher price for advanced features.
Piktochart AI
- Pros: User-friendly, AI-driven design, extensive template library, affordable pricing.
- Cons: Limited advanced data visualization, less customizable for complex data.
Pricing Comparison
Infogram offers a free plan with basic features, then paid plans starting at $19/month (billed annually) for Pro, and $49/month for Business. Piktochart AI has a free plan with limited features, then Pro at $14/month (billed annually) and Team at $24/month per user. Piktochart AI is generally more budget-friendly, especially for small teams.
Best Use Cases
- Infogram: Ideal for data journalists, analysts, and businesses that need interactive charts, real-time data dashboards, and detailed reporting.
- Piktochart AI: Perfect for marketers, educators, and non-designers who want to quickly create visually appealing infographics, social media graphics, and presentations without a steep learning curve.
Verdict
Choose Infogram if your priority is advanced data visualization and interactivity. Choose Piktochart AI if you value ease of use, AI assistance, and cost-effectiveness for general design tasks. Both tools are excellent, but they serve different primary purposes.
FAQ
Can I import data from Excel or Google Sheets?
Yes, both Infogram and Piktochart AI allow importing data from Excel and Google Sheets, but Infogram offers more advanced data handling and live syncing.
Which tool is better for beginners?
Piktochart AI is more beginner-friendly due to its intuitive interface and AI design suggestions, while Infogram has a steeper learning curve.
Do both tools offer free plans?
Yes, both offer free plans with limited features. Infogram’s free plan includes basic charts, while Piktochart AI’s free plan includes limited templates and exports.
Can I embed my visuals on a website?
Both allow embedding, but Infogram provides more robust embedding options with interactive features, while Piktochart AI offers simpler embed codes.
Visual Comparison
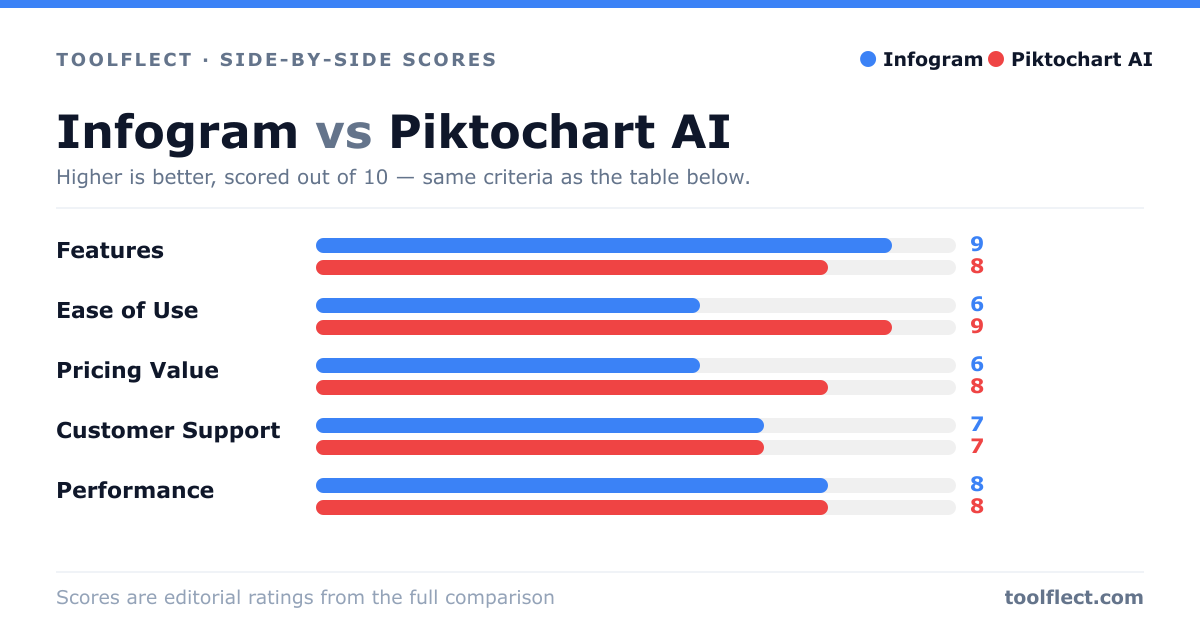
| Criterion | Infogram | Piktochart AI |
|---|---|---|
| Features | 8/10 – Advanced data visualization, interactive charts, real-time data | 7/10 – AI design assistance, infographics, basic charts |
| Ease of Use | 7/10 – Intuitive but some learning curve for complex features | 9/10 – Very user-friendly, AI simplifies design |
| Pricing Value | 7/10 – Higher cost for full features, free plan limited | 8/10 – Affordable plans, good free tier |
| Customer Support | 8/10 – Responsive support, extensive help center | 7/10 – Support available, but slower response times |
| Performance | 8/10 – Handles large datasets well, occasional lags | 8/10 – Fast and reliable for standard tasks |